Search Logs
The Search Logs interface provides administrators with comprehensive analytics and detailed logs of all search activities performed in the LinQ Explorer system. This includes cohort searches and notes queries, with insights into usage patterns, platform distribution (Web vs API), and detailed activity records.
Accessing the Search Logs Interface
To access the Search Logs interface:
- Navigate to App Management from the main navigation
- Click on Search Logs from the App Management menu
- The Search Logs dashboard will display analytics and detailed logs of all search activities
Search Logs Dashboard Overview
The Search Logs interface provides a comprehensive dashboard view with key performance indicators (KPIs), visual analytics, and detailed activity logs. The interface is divided into multiple sections for easy analysis of search patterns and usage statistics.
Filter Options
The header section contains several filter options that allow you to refine the search logs data:
- Date Range: Select a date range using the calendar picker. The date range is displayed in "MM/DD/YYYY - MM/DD/YYYY" format (e.g., "11/14/2025 - 02/12/2026")
- Platform: A dropdown menu to filter by platform type (Web, API, or All)
- Component: A dropdown menu to filter by component type (e.g., Cohort Builder, Notes Query, LinQ Notes)
- Organization: A dropdown menu to filter by organization (e.g., Norstella, Syneos)
- User: A text field to filter by specific user name. By default, it shows "Show All"
These filters work together to help you analyze search activity by specific criteria. When you change any filter, the dashboard metrics, charts, and data table will update accordingly.
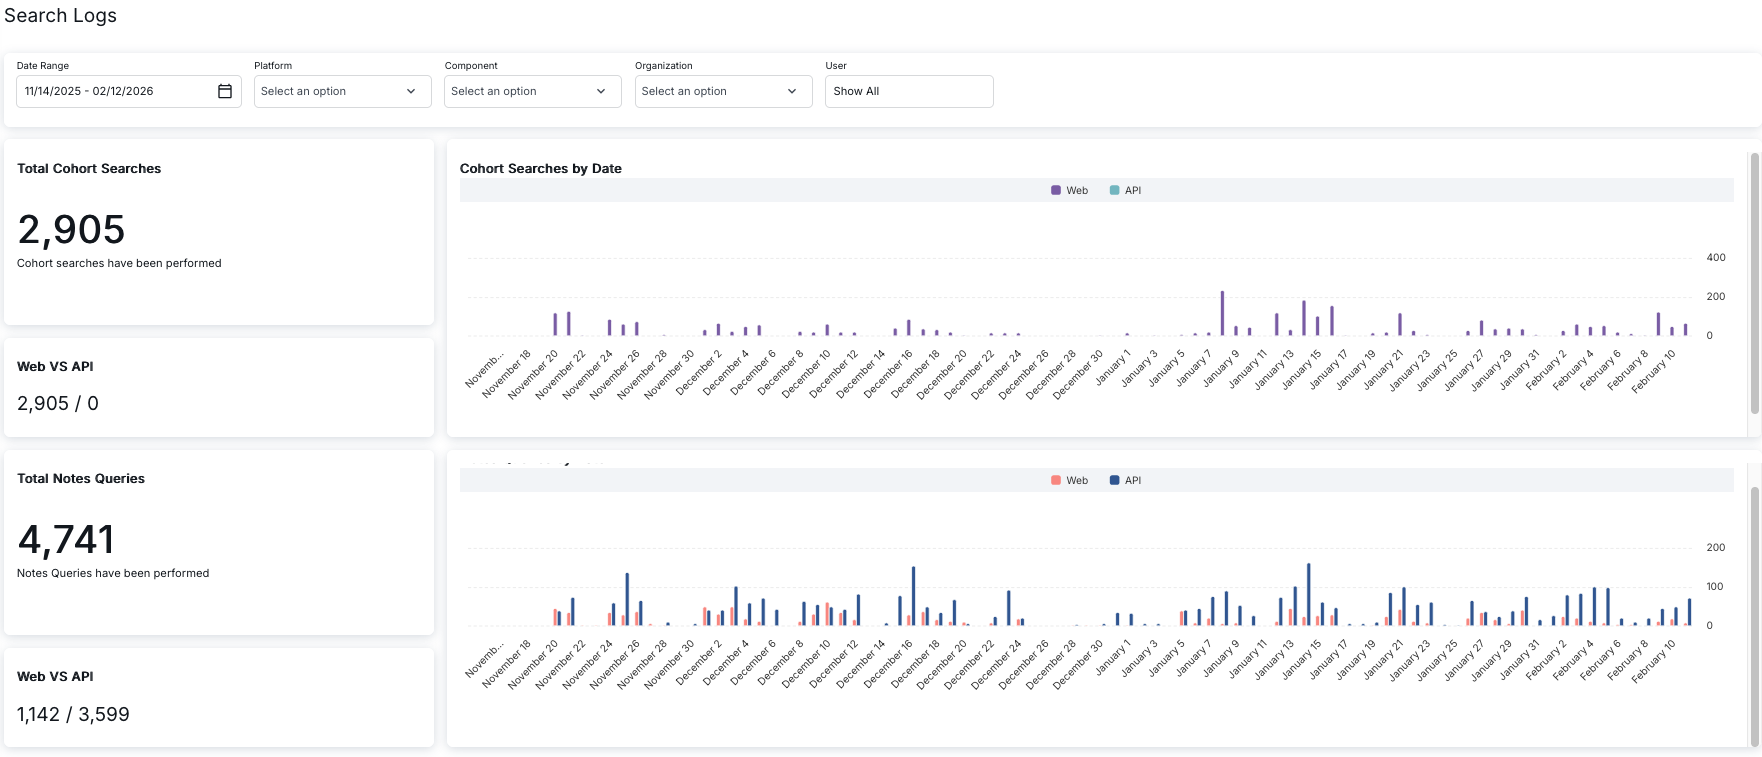
Key Performance Indicators (KPIs)
The left column of the dashboard displays key performance indicators in separate cards:
Total Cohort Searches
This KPI card displays:
- Total Count: A large number showing the total number of cohort searches performed (e.g., "2,905")
- Description: Text below the number indicating "Cohort searches have been performed"
Web VS API (for Cohort Searches)
This KPI card shows the distribution of cohort searches between web and API platforms:
- Format: "Web Count / API Count" (e.g., "2,905 / 0")
- Web Count: Number of cohort searches performed through the web interface
- API Count: Number of cohort searches performed through the API
This helps administrators understand how users are accessing the cohort search functionality.
Total Notes Queries
This KPI card displays:
- Total Count: A large number showing the total number of notes queries performed (e.g., "4,741")
- Description: Text below the number indicating "Notes Queries have been performed"
Web VS API (for Notes Queries)
This KPI card shows the distribution of notes queries between web and API platforms:
- Format: "Web Count / API Count" (e.g., "1,142 / 3,599")
- Web Count: Number of notes queries performed through the web interface
- API Count: Number of notes queries performed through the API
This helps administrators understand the usage patterns for notes queries, which may show a different distribution than cohort searches.
Analytics Charts
The right column of the dashboard contains two time-series bar charts that visualize search activity over time:
Cohort Searches by Date
The top chart displays cohort search activity over time:
- Chart Type: Stacked bar chart showing daily activity
- X-Axis: Dates (e.g., "November 18", "November 20", "December 2", "January 1", "February 10")
- Y-Axis: Number of searches (ranges from 0 to 400, with major ticks at 200 and 400)
- Legend: Shows "Web" (purple) and "API" (light blue) to distinguish between platform types
- Data Visualization: Bars are color-coded to show the split between web and API searches for each day
This chart helps identify peak usage periods, trends, and patterns in cohort search activity. Noticeable peaks may occur on specific dates, indicating high user activity or important events.
Notes Queries by Date
The bottom chart displays notes query activity over time:
- Chart Type: Stacked bar chart showing daily activity
- X-Axis: Dates (mirrors the cohort searches chart for easy comparison)
- Y-Axis: Number of queries (ranges from 0 to 200, with a major tick at 100)
- Legend: Shows "Web" (red) and "API" (dark blue) to distinguish between platform types
- Data Visualization: Bars are color-coded to show the split between web and API queries for each day
This chart helps identify peak usage periods, trends, and patterns in notes query activity. The distribution between web and API usage may differ from cohort searches, providing insights into how different features are accessed.
Search Logs Data Table
Below the dashboard, a detailed data table provides comprehensive information about individual search log entries:
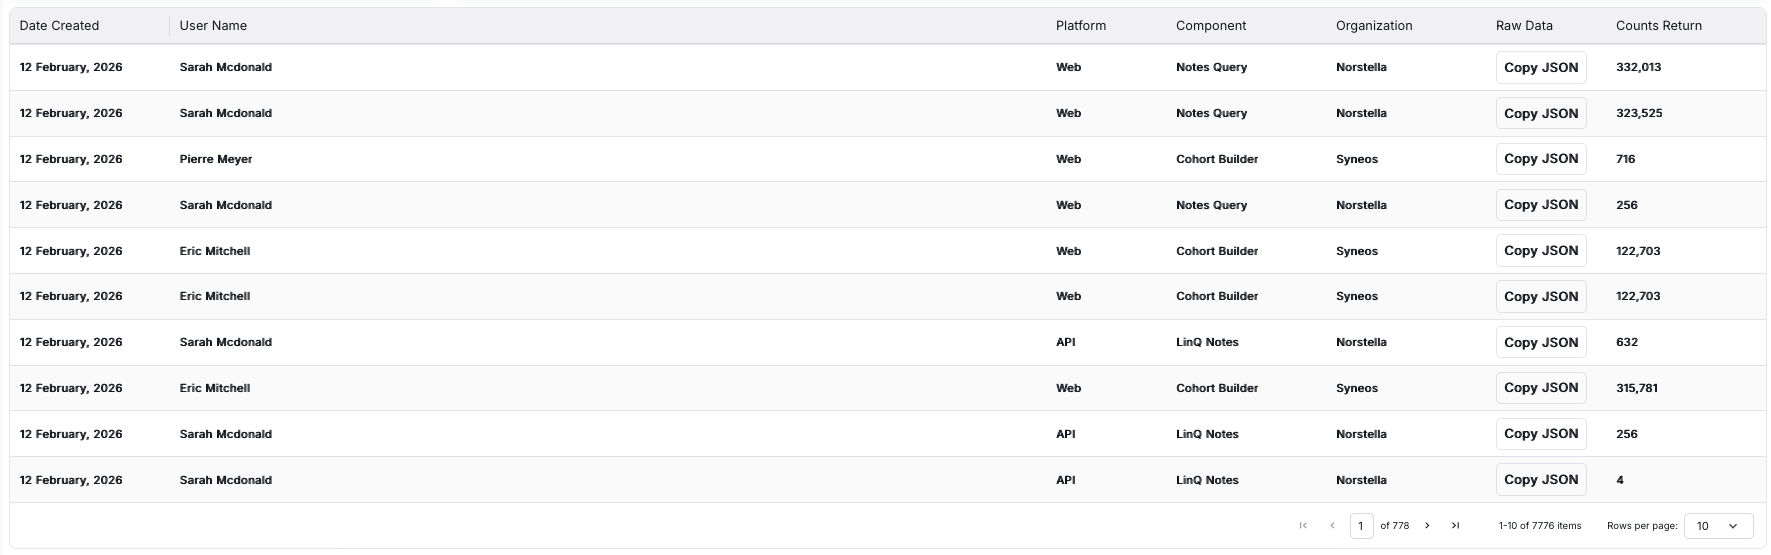
Table Columns
- Date Created: The date and time when the search was performed, displayed in "DD Month, YYYY" format (e.g., "12 February, 2026")
- User Name: The name of the user who performed the search (e.g., "Sarah Mcdonald", "Pierre Meyer", "Eric Mitchell")
- Platform: The platform used for the search, either "Web" or "API"
- Component: The component or feature used for the search (e.g., "Notes Query", "Cohort Builder", "LinQ Notes")
- Organization: The organization associated with the user (e.g., "Norstella", "Syneos")
- Raw Data: Contains a "Copy JSON" button that allows you to copy the raw JSON data for that search log entry
- Counts Return: The number of results returned by the search, displayed as a numerical value (e.g., "332,013", "323,525", "716", "256", "122,703", "632", "315,781", "4")
Using the Raw Data Column
The "Raw Data" column provides access to the complete JSON data for each search log entry:
- Click the "Copy JSON" button for any row
- The JSON data for that search log entry will be copied to your clipboard
- You can paste this data into a text editor or JSON viewer for detailed analysis
This feature is useful for debugging, detailed analysis, or exporting search log data for further processing.
Row Selection and Highlighting
Rows in the table can be selected or highlighted:
- Hover Effect: When you hover over a row, it may be highlighted with a slightly darker background color
- Selection: Clicking on a row may select it for further actions or to view additional details
Pagination Controls
When there are many search log entries, the table uses pagination to display entries in manageable pages. The pagination controls are located at the bottom of the table.
Pagination Features
- Page Indicator: Shows the current page number and total pages (e.g., "1 of 778")
- Item Count: Displays the range of items shown and total items (e.g., "1-10 of 7776 items")
- Rows Per Page: A dropdown menu allowing you to select how many entries to display per page (default is 10). Available options typically include 10, 25, 50, 100, etc.
- Navigation Arrows: Four navigation buttons:
- First page (K icon): Jump to the first page
- Previous page (< icon): Go back one page
- Next page (> icon): Advance one page
- Last page (>| icon): Jump to the last page
Using Pagination
To navigate through multiple pages of search logs:
- Use the arrow buttons to move between pages
- Click the first/last page buttons to jump to the beginning or end of the list
- Use the "Rows per page" dropdown to change how many entries are displayed per page (10, 25, 50, 100, etc.)
- The page indicator shows your current position in the list
- You can also type a page number directly into the page number input field to jump to a specific page
Key Features Summary
- Comprehensive Analytics: View key performance indicators for cohort searches and notes queries
- Platform Distribution: Understand how users access features through Web vs API
- Visual Analytics: Time-series charts show trends and patterns in search activity
- Advanced Filtering: Filter logs by date range, platform, component, organization, and user
- Detailed Logs: Access comprehensive information about each search activity
- Raw Data Access: Copy JSON data for detailed analysis or export
- Usage Tracking: Monitor search counts and result volumes
- Efficient Navigation: Use pagination to browse through large volumes of log entries
- User Activity Monitoring: Track which users are performing searches and when
- Component Analysis: Understand which components (Cohort Builder, Notes Query, etc.) are most frequently used