Dashboard Overview
The Dashboard is your central hub for managing cohorts, viewing recent projects, and accessing comprehensive cohort analytics. It provides quick access to all your cohort-related activities.
Dashboard Sections
The Dashboard consists of three main sections:
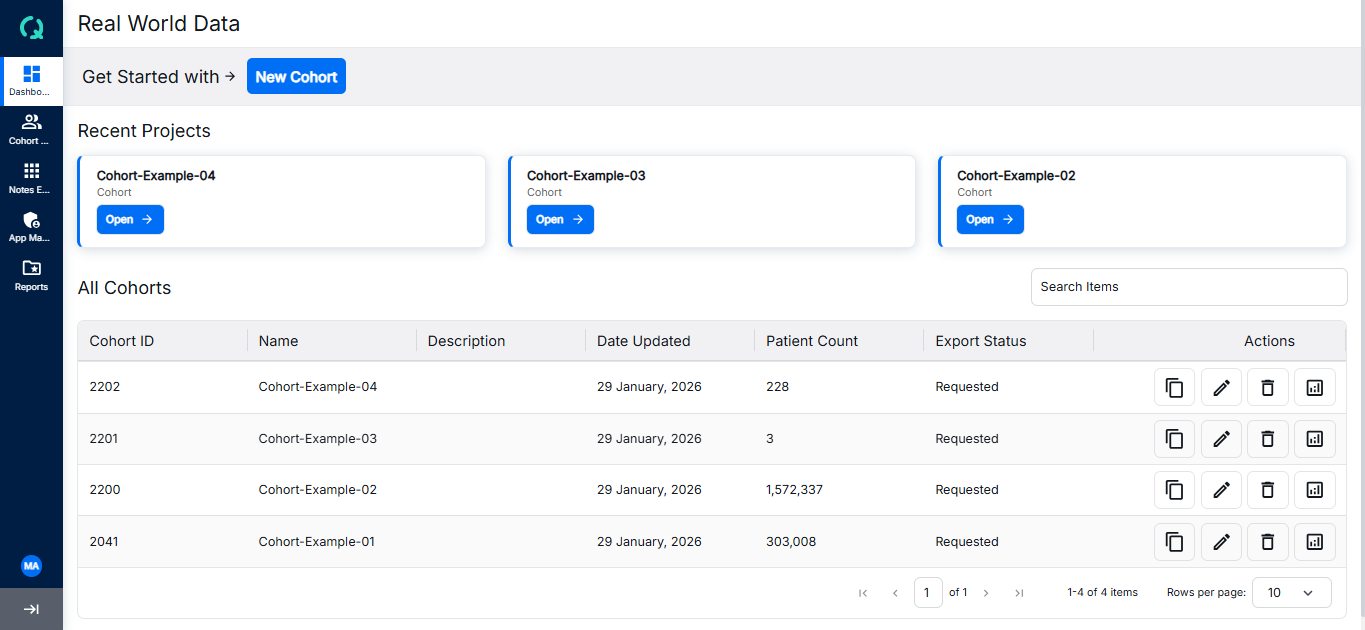
1. New Cohort Button
The first section features a "New Cohort" button. Clicking on it navigates you to the Cohort Analytics tab where you can create a new cohort by selecting various criteria.
2. Recent Projects
The second section displays your three most recent projects (cohorts) that you have created. Each project has an "Open" button that navigates to the edit screen of the cohort where you can modify selection criteria.
Recent Projects
View and manage your recent cohort projects
Create a Cohort
Learn how to create a new cohort
3. Cohort Table
The third section displays a comprehensive table of all cohorts, sorted by date. The table includes an Action column with buttons for delete, update, and analyze operations. The analyze button navigates to a deep view where you can explore funnel details, patient demographics, event analytics, line of therapy, SOW, and various reports for the selected cohort.