Event Analytics
Event Analytics provides detailed analysis of clinical events, procedures, diagnoses, and other healthcare events that occur within your cohort. This feature enables you to track event patterns, timelines, and frequencies to understand patient care journeys and outcomes.
Event Analytics Interface
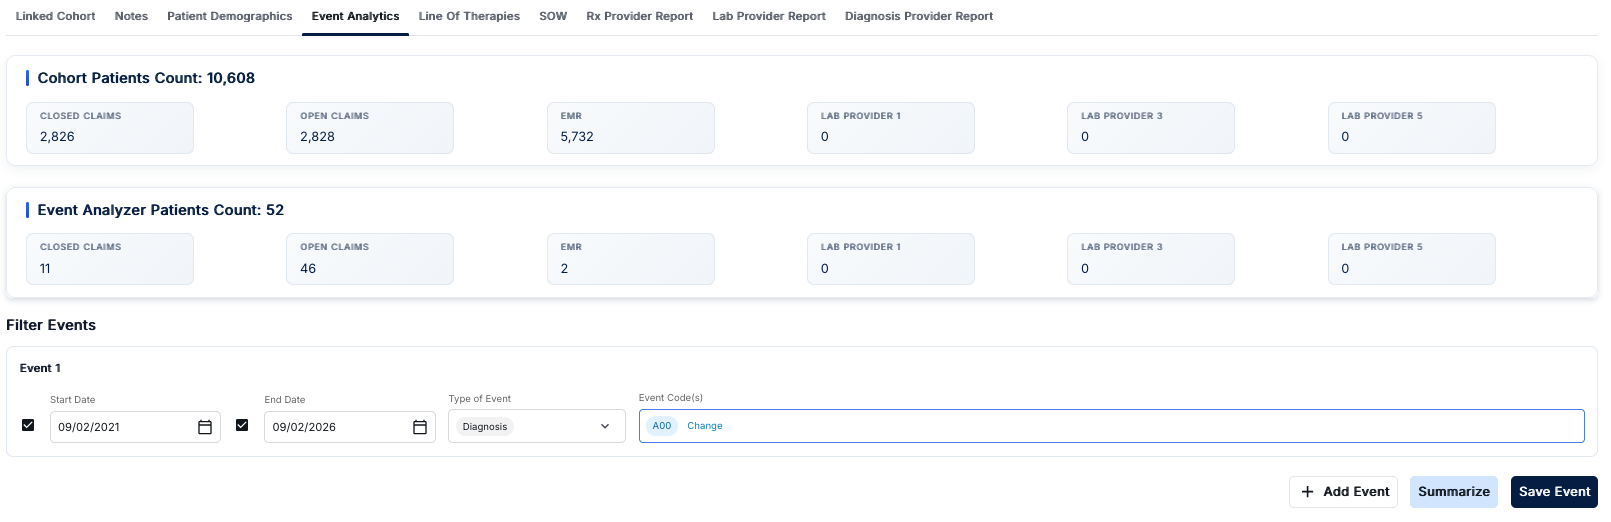
The Event Analytics interface provides a comprehensive view of patient counts and event filtering capabilities. Access this view by clicking on the "Event Analytics" tab in the Cohort Analytics navigation bar. The interface displays patient count summaries and allows you to filter and analyze specific events.
Cohort Patients Count
The top section displays "Cohort Patients Count" showing the total number of patients in your cohort (e.g., 10,608 patients). This section includes five data source cards:
- CLOSED CLAIMS: Patient count from closed insurance claims data
- OPEN CLAIMS: Patient count from open insurance claims data
- EMR: Patient count from Electronic Medical Records
- LAB PROVIDER 1, 3, 5: Patient counts from various laboratory data providers
These cards provide a baseline view of your entire cohort population across different data sources.
Event Analyzer Patients Count
Below the cohort count section is the "Event Analyzer Patients Count" section, which shows a filtered subset of patients (e.g., 52 patients) that match your event filter criteria. This section displays the same data source cards but with counts specific to the filtered event:
- CLOSED CLAIMS: Filtered patient count from closed claims
- OPEN CLAIMS: Filtered patient count from open claims
- EMR: Filtered patient count from EMR records
- LAB PROVIDER 1, 3, 5: Filtered patient counts from laboratory providers
The difference between the cohort count and event analyzer count shows how many patients in your cohort match the specific event criteria you've defined.
Filter Events Section
The bottom section allows you to define and filter events. Each event filter includes:
Event Configuration
- Start Date: Checkbox to enable/disable the start date filter, with a date picker (e.g., 09/02/2021) and calendar icon for selecting the date
- End Date: Checkbox to enable/disable the end date filter, with a date picker (e.g., 09/02/2026) and calendar icon for selecting the date
- Type of Event: Dropdown menu to select the event type (e.g., "Diagnosis", "Procedure", "Medication", etc.)
- Event Code(s): Input field for entering event codes (e.g., ICD-10 diagnosis codes like "A00"). Codes appear as tags that can be edited or removed. You can add multiple codes to a single event filter.
Action Buttons
Three action buttons are available at the bottom of the Filter Events section:
- + Add Event: Adds a new event filter row (Event 2, Event 3, etc.) allowing you to create multiple event filters for complex analyses
- Summarize: Processes the event filters and updates the Event Analyzer Patients Count section with the filtered results
- Save Event: Saves the current event filter configuration for future use
Understanding Event Analytics
Event Analytics tracks and analyzes various healthcare events including diagnoses, procedures, hospitalizations, emergency visits, and other clinical events. This analysis helps you understand the sequence and timing of events in your patient population.
Key Features
- Cohort vs. Event Analyzer Comparison: Compare total cohort patient counts with filtered event-specific counts
- Multi-Source Data Integration: View patient counts across claims, EMR, and laboratory providers
- Date Range Filtering: Filter events by start and end dates to analyze specific time periods
- Event Type Selection: Filter by event type (Diagnosis, Procedure, Medication, etc.)
- Event Code Filtering: Specify specific event codes (e.g., ICD-10 diagnosis codes) to filter patients
- Multiple Event Filters: Add multiple event filters to create complex event-based patient subsets
- Event Configuration Saving: Save event filter configurations for reuse
How to Use Event Analytics
- Navigate to the Cohort Analytics section and select a cohort
- Click on the "Event Analytics" tab in the top navigation bar
- Review the Cohort Patients Count section to see your total patient population
- In the Filter Events section, configure your event filter:
- Check the Start Date checkbox and select a start date using the calendar picker
- Check the End Date checkbox and select an end date using the calendar picker
- Select the Type of Event from the dropdown (e.g., "Diagnosis")
- Enter Event Code(s) in the input field (e.g., "A00" for an ICD-10 diagnosis code)
- Click "Summarize" to apply the filter and see the filtered patient count in the Event Analyzer Patients Count section
- To add additional event filters, click "+ Add Event" to create Event 2, Event 3, etc.
- Click "Save Event" to save your event filter configuration for future use
- Compare the Cohort Patients Count with the Event Analyzer Patients Count to understand how many patients match your event criteria
Understanding Event Filtering
Event filtering allows you to:
- Identify Patient Subsets: Find patients who experienced specific events within a defined time period
- Analyze Event Prevalence: Understand how many patients in your cohort match specific event criteria
- Compare Data Sources: See how event filtering affects patient counts across different data sources (claims, EMR, labs)
- Create Complex Queries: Use multiple event filters to identify patients with complex event patterns
The Event Analyzer Patients Count shows the intersection of your event filter criteria with your cohort, helping you understand how event-based filtering narrows your patient population.
Best Practices
- Start with broad date ranges and specific event codes, then narrow down based on results
- Use the comparison between Cohort Patients Count and Event Analyzer Patients Count to understand filter impact
- Save frequently used event filter configurations for quick access
- Review patient counts across all data sources to understand data coverage for your filtered events
- Use multiple event filters to identify patients with complex event sequences or patterns
- Document your event filter criteria when reporting results or sharing analyses
- Consider data source differences when interpreting filtered patient counts (e.g., EMR vs. claims data)