Cohort Analytics Overview
Cohort Analytics is a powerful feature that allows you to build patient cohorts by searching for patients using different criteria based on multiple factors. Once you create a cohort, you can analyze deep insights including funnel details, patient demographics, event analytics, and more.
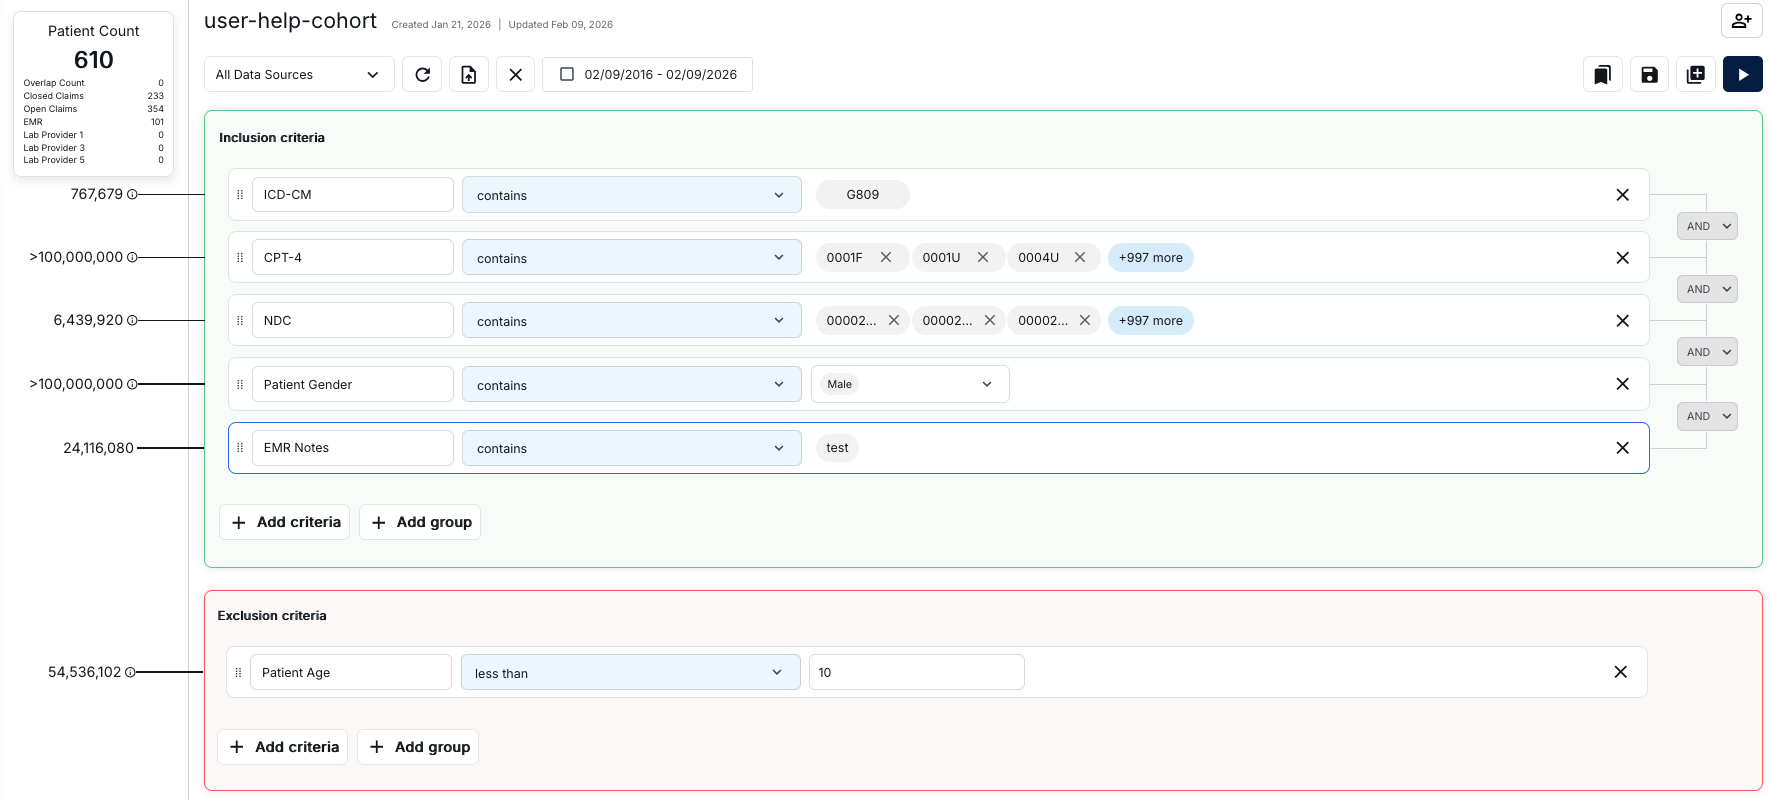
Cohort Builder Interface
The Cohort Builder interface is a comprehensive workspace for defining patient cohorts using inclusion and exclusion criteria. The interface provides real-time feedback on patient counts and allows you to build complex cohort definitions with multiple criteria types.
Header and Toolbar
The top section of the interface includes:
- Cohort Name: Displays the current cohort name and shows creation and update dates
- Data Sources Dropdown: Select "All Data Sources" or filter by specific data sources
- Toolbar Icons:
- Refresh icon to reload data
- Save icon to save your cohort
- Document with plus icon to create new documents
- Close icon (X) to exit
- Date range picker to filter by specific date ranges
- Bookmark, save, add, and play buttons for additional actions
- User icon with plus sign for managing user access
Patient Count Panel
The left sidebar displays real-time statistics about your cohort:
- Total Patient Count: Shows the current number of patients matching all criteria
- Data Source Breakdown: Displays patient counts by data source:
- Overlap Count: Patients appearing in multiple data sources
- Closed Claims: Patients from closed insurance claims
- Open Claims: Patients from open insurance claims
- EMR: Patients from Electronic Medical Records
- Lab Providers: Patients from various laboratory data sources
- Individual Criterion Counts: Each criterion row shows the number of patients matching that specific criterion before it's combined with others
Inclusion Criteria Section
The Inclusion Criteria section (indicated by a green border) defines the conditions that patients must meet to be included in your cohort. Each criterion row includes:
- Drag Handle: Six dots icon on the left to reorder criteria
- Criterion Type: Dropdown to select the type (e.g., ICD-CM, CPT-4, NDC, Patient Gender, EMR Notes)
- Operator: Dropdown to select the logical operator (e.g., "contains", "less than", "equals")
- Value Field: Input area to specify the criterion values
- Patient Count: Shows how many patients match this individual criterion
- Logical Connector: Dropdown (typically "AND" or "OR") to connect multiple criteria
- Remove Button: X icon to delete the criterion
You can add multiple criteria and connect them with AND/OR logic. All inclusion criteria must be met (when using AND) or at least one must be met (when using OR) for a patient to be included.
Exclusion Criteria Section
The Exclusion Criteria section (indicated by a red border) defines conditions that will exclude patients from your cohort, even if they meet all inclusion criteria. The structure is identical to the inclusion criteria section, but these criteria filter out patients rather than include them.
Adding Criteria
Both sections provide two action buttons:
- + Add criteria: Adds a single criterion row
- + Add group: Creates a group of criteria for more complex logical combinations
Example Criteria Types
The interface supports various criterion types including:
- Diagnosis Codes: ICD-CM codes (e.g., "G809")
- Procedure Codes: CPT-4 codes (e.g., "0001F", "0001U", "0004U")
- Medications: NDC codes for specific drugs
- Demographics: Patient Gender, Patient Age, Race, State, Zip3
- Clinical Notes: EMR Notes with text search capabilities
What You Can Do
With Cohort Analytics, you can:
- Create new cohorts with custom selection criteria
- Edit existing cohorts to modify their criteria
- Analyze cohort data with comprehensive reports
- View funnel details and patient demographics
- Explore event analytics and line of therapy data