Dashboard Overview
The Dashboard is your central hub for managing cohorts and accessing cohort analytics. It provides a comprehensive view of all your cohorts with quick access to create, edit, and analyze patient populations.
Dashboard Interface
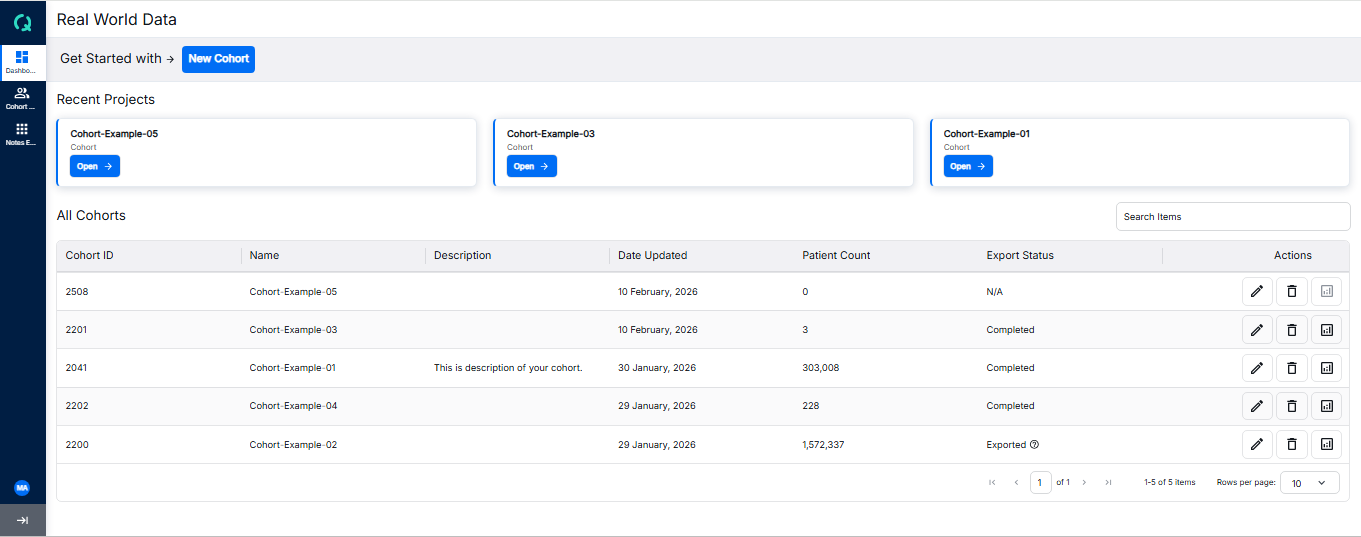
The Dashboard displays your cohorts in a table view with key information and actions readily available.
Header Section
The header includes the title "All Cohort Analytics" and a + New Cohort button to quickly create a new cohort.
Cohort Table
The main section displays all your cohorts in a table format with the following columns:
- Cohort ID: Unique identifier for each cohort
- Name: The name you assigned to the cohort
- Description: Brief description of the cohort's purpose
- Date Updated: When the cohort was last modified
- Patient Count: Total number of patients in the cohort
- Export Status: Current status of data export (Completed, Requesting, Pending, Failed, N/A)
- Actions: Edit, Delete, and Analyze icons
Actions
Each cohort row provides quick action buttons:
- Edit: Modify the cohort's inclusion and exclusion criteria
- Delete: Remove the cohort from the system
- Analyze: Navigate to deep analytics including Linked Cohort, Patient Demographics, Line of Therapies, and SOW
Key Features
- Quick Cohort Creation: Use the "+ New Cohort" button to start creating a new cohort
- Cohort Management: Edit, delete, or analyze any existing cohort
- Status Tracking: Monitor export status for each cohort
- Deep Analytics: Access detailed analytics through the Analyze action
Getting Started
- Click + New Cohort to create your first cohort
- Define inclusion and exclusion criteria for your patient population
- Save and build your cohort
- Use the Analyze icon to explore detailed analytics
Explore the sections below to learn more about Dashboard features: