Linked Cohort
The Linked Cohort view provides a comprehensive overview of patient data across multiple data sources. This feature displays patient counts from different providers in a Funnel visualization, allowing you to understand data coverage and merge cohorts for integrated analyses.
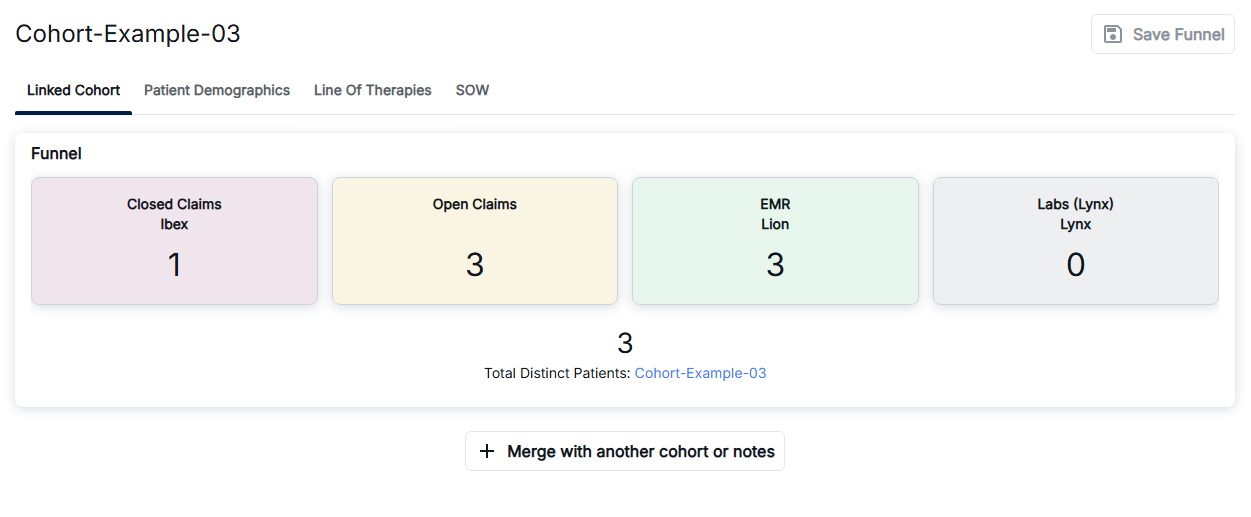
Linked Cohort - Funnel View with Patient Counts
Linked Cohort Interface
The Linked Cohort interface displays your cohort name at the top (e.g., "Cohort-Example-03") along with a Save Funnel button to save your current configuration. The tabbed navigation provides access to different analytical views.
Navigation Tabs
The navigation bar provides access to the following views:
- Linked Cohort: View patient counts from multiple data sources in the Funnel view (current tab)
- Patient Demographics: Analyze patient demographic information
- Line Of Therapies: Review treatment line information
- SOW: Access Statement of Work reports
The Funnel View
The Funnel section displays patient counts from four data sources, each shown as a colored card:
- Closed Claims (Ibex): Patient count from closed insurance claims data (shown in light purple)
- Open Claims: Patient count from open insurance claims data (shown in light yellow)
- EMR (Lion): Patient count from Electronic Medical Records (shown in light green)
- Labs (Lynx): Patient count from laboratory data providers (shown in light grey)
Below the data source cards, the Total Distinct Patients count is displayed with a link to the cohort name, showing the combined unique patient population across all linked data sources.
Merging Cohorts and Notes
The "+ Merge with another cohort or notes" button allows you to combine this linked cohort with additional cohorts or clinical notes:
- Combine patient populations from multiple cohorts
- Integrate clinical notes data with cohort data
- Create comprehensive patient datasets for analysis
Key Features
- Multi-Source Data Integration: View patient data from Claims, EMR, and Labs in one place
- Patient Count Visualization: Color-coded cards show counts from each data source
- Total Distinct Patients: Automatically calculated unique patient count across all sources
- Save Funnel: Save your current funnel configuration for future reference
- Cohort Merging: Combine cohorts and notes to create comprehensive datasets
How to Use Linked Cohorts
- Navigate to the Cohort Analytics section and select a cohort
- Click on the "Linked Cohort" tab in the navigation bar
- Review the Funnel view to see patient counts from each data source
- Check the Total Distinct Patients count to understand the combined patient population
- Click "Save Funnel" to save your current configuration
- Use "+ Merge with another cohort or notes" to combine with additional data
- Navigate to other tabs (Patient Demographics, Line Of Therapies, SOW) for additional analysis
Understanding the Data Sources
The Funnel view displays patient counts from various data providers:
- Closed Claims (Ibex): Insurance claims that have been processed and closed
- Open Claims: Insurance claims that are still being processed
- EMR (Lion): Electronic Medical Records from the Lion provider
- Labs (Lynx): Laboratory data from the Lynx provider
The system automatically deduplicates patients across all sources to calculate the total distinct patient count, ensuring accurate population size calculations.
Best Practices
- Review patient counts from each data source to understand data coverage
- Use the Total Distinct Patients count to understand the true population size
- Save your funnel configuration before making changes
- Use the merge functionality to combine related cohorts for comprehensive analysis
- Explore different navigation tabs for various analytical perspectives